Winterforecast 2018/19 door Judah Cohen


20 december 2018 -
7 min. lezen
4 reacties
Seasonal climate prediction is not a new discipline but advances have been slow. Long range or statistical forecasts began in the 1950s when scientists first identified large scale atmospheric patterns and recognized relationships between atmospheric variability and ocean temperature anomalies. In the 1980s, seasonal prediction was based on lag correlations with observed upper atmosphere geopotential height anomalies.
But the most important predictor beginning in the 1980’s and through today is the use of El Niño/Southern Oscillation or (ENSO) in seasonal forecasts. Today the government sponsored operational centers no longer rely on statistical models but instead on dynamical models, still the main contributor to forecast accuracy of the dynamical models continues to be ENSO.
- Meer updates lezen over de stratosfeer? Volg op Youtube!
In contrast I have focused my research on the contribution of Arctic forcings on mid-latitude weather especially on winter and at seasonal timescales. Much of my research has been on the relationship between October Siberian snow cover extent on winter surface temperature anomalies across the Northern Hemisphere (NH). When October Siberian snow cover is extensive, winter temperatures are relatively cold across Northern Eurasia including Northern Europe and the Eastern US with relatively mild temperatures across the Mediterranean, North Africa and Northeast Canada.
More recently I have also been researching the relationship between Arctic sea ice extent and winter weather. In general, reduced Arctic sea ice extent is related to cold temperatures across the NH but regionality is important. Low sea ice in the Barents Kara Seas favor cold in Asia, low sea ice in the Chukchi and Bering Seas favor cold in eastern North America and low sea ice around Greenland favors cold in Northern Europe.
I and others have argued that Siberian snow cover and Arctic sea ice can influence winter weather across the mid-latitudes through interactions with the polar vortex (PV). The PV is a fast-flowing ribbon or river of air that circumnavigates the Arctic high above the earth’s surface in the stratosphere. When the PV is strong, cold air remains confined over the Arctic while the mid-latitudes are relatively mild, but when the PV is perturbed or weak the Jet Stream becomes wavier or more meandering, allowing cold air from the Arctic to be transported to the mid-latitudes including Europe and the Eastern US. Both extensive October Siberian snow cover and diminished Arctic sea ice extent in the Barents-Kara Seas are related to a weaker or more perturbed winter PV and colder winter temperatures.
For this winter, the relative tropical and Arctic seasonal predictors consist of an El Niño likely of weak to moderate amplitude, October Siberian snow cover extent was above normal and Arctic sea ice extent is below normal but especially in the Barents-Kara Seas. An El Niño favors warm across northwestern North America and relatively cold temperatures in the Southeastern US, extensive Siberian snow cover extent and low sea ice especially in the Barents-Kara Seas favor a relatively weak PV and cold temperatures across Northern Europe, Northern Asia and the Eastern US. I include the winter surface temperature anomalies from three dynamical model products and from the AER statistical model. The first model forecast is from the North American Multi-Model Ensemble (NMME). The NMME system includes coupled models from a number of US and Canadian modeling centers. The second forecast is from an international suite of models including the CFSv2 (climate forecast system version 2), the European Centre for Medium-range Weather Forecasting (ECMWF) model, the UK Met Office Hadley Center Unified Model and the and the MeteoFrance model. The third forecast is from the American CFSv2 model only. The final forecast is from the AER statistical model. The major predictors used in the model are predicted winter ENSO (Niño 3.4 index), estimated November Barents-Kara sea ice concentration anomaly, October Eurasian snow cover extent anomaly and October sea level pressure (SLP) anomaly in northwestern Asia
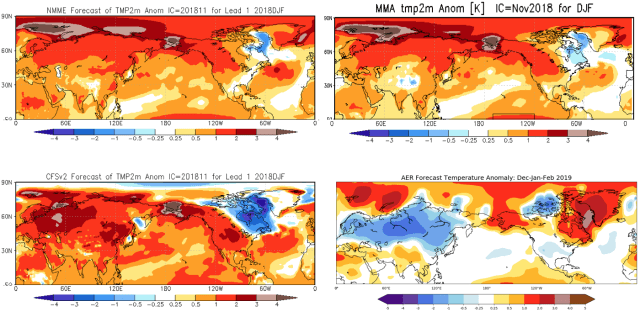
All of the dynamical models show a similar forecast with widespread relatively warm temperatures across the NH including all of Asia, the United States including Alaska and most of Canada. Some models do predict relatively cold temperatures in northeastern Canada possibly related to above normal sea ice in the region. In contrast the AER statistical model predicts relatively warm temperatures across much of Southern Asia, Southern Europe, Alaska and much of Canada with seasonable to cold temperatures across Northern Asia, Northern Europe and the United States. The statistical model forecast can be interpreted as anticipating a weakened PV, followed by severe winter weather across northern Eurasia and the Eastern United States.
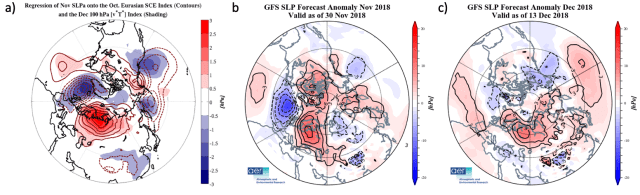
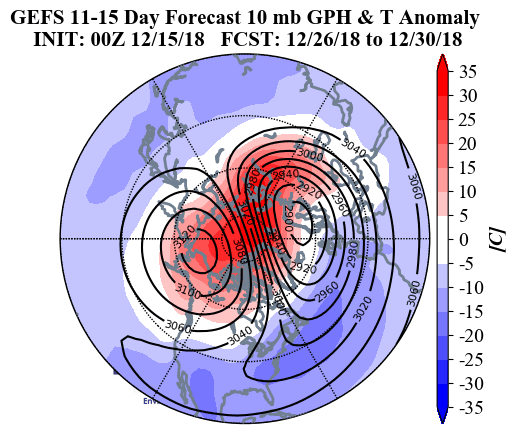
I have shown in several papers that a northwestward expansion of the Siberian high is favorable for disrupting the PV. In November and again in December strong positive SLP anomalies have been observed across northwestwern Eurasia. I include in Figure 2, the SLP pattern found favorable to disrupting the PV and the SLP anomalies observed for November 2018 and projected for December 2018. In all three the dominant SLP anomaly is positive center across Northwestern Eurasia. All the dynamical models are predicting a significant PV disruption for the end of December and the question remains whether during this event zonal mean zonal winds at 60°N and 10 hpa will reverse from westerly to easterly, which is the definition of a major midwinter warming (MMW).
There are two types of PV disruptions displacements and splits. In a PV displacement the PV remains intact but is displaced off the North Pole and weakens. In a PV split the original one PV splits into two sister vortices that then tend to meander closer to the mid-latitudes. A nice example of a PV split occurred in February 2018. Following last winter’s PV split it turned much colder across Europe including Western Europe and at least initially mild in the Eastern US. The weather models are all predicting a PV displacement into late December.
Analysis of surface temperatures of all PV displacements over the past two decades suggests that the month a PV displacement is observed and the following one or even two months temperatures in the Eastern US are relatively cold. Europe including Western Europe is relatively mild following most PV displacements with more mixed temperatures across Asia.
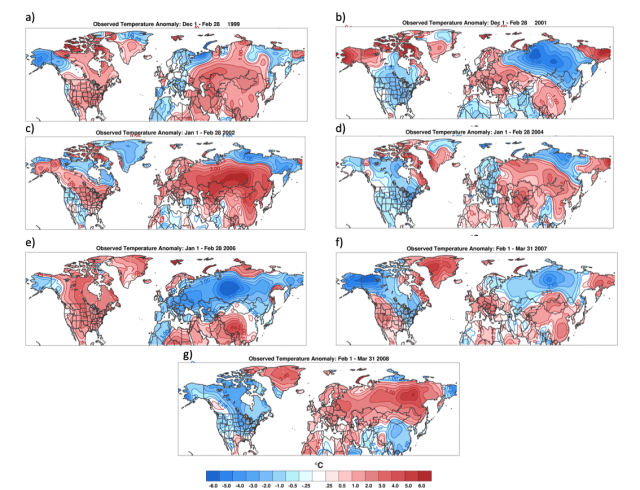
Therefore, based on the expectation of PV displacement, I expect a relatively cold winter in the Eastern US but in contrast a relatively mild winter in Western Europe. I also expect a relatively cold winter across Northern Asia especially Siberia based on the anticipation of continued blocking in the Barents Kara Seas, which favors cold temperatures downstream across Asia.