Winter forecast 2024 door Judah Cohen


2
After La Niña three years in a row, we are finally in a moderate to strong El Niño. Despite the change from La Niña to El Niño, the dynamical model forecasts are not that different from the past three winters, especially over Eurasia. The most commonly used predictor in seasonal prediction is the El Niño/Southern Oscillation or (ENSO). The government forecast centres rely mostly on dynamical models for seasonal forecasts and they are very sensitive to the phase of ENSO (I would argue too sensitive).
Focus op zachte periodes?
In Figuur1, I include the multi-model ensemble from the North American models (NNME; includes coupled models from a number of US and Canadian modeling centers) and from the European models (C3S) including the European Centre for Medium-range Weather Forecasting (ECMWF) model, the UK Met Office Hadley Center Unified Model and the and the MeteoFrance model. Almost universal warmth is predicted across Eurasia and North America with the exception of normal temperatures in the Southeastern United States (US).
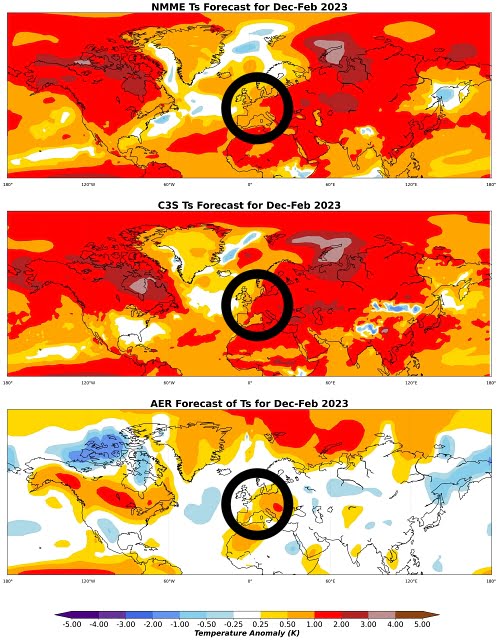
Also, the relative warmth increases across the continents increases at higher latitude especially across Canada and Russia know as Arctic amplification. Therefore, despite the El Niño, the models have defaulted to a “global warming” forecast with above normal temperatures throughout the continents.
Onderzoek naar toename sneeuwdek Siberië
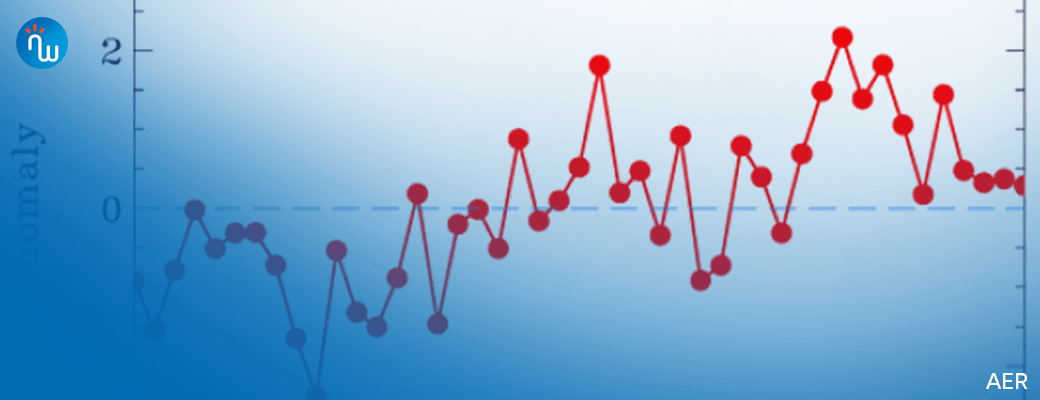
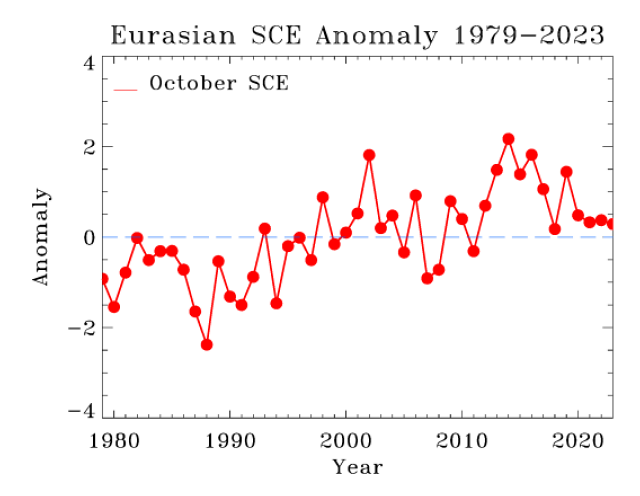
In contrast, I have focused my research on the contribution of Arctic forcings on mid-latitude weather especially on winter and at seasonal timescales. Much of my research has been on the relationship between October Siberian snow cover extent on winter surface temperature anomalies across the Northern Hemisphere (NH).
When October Siberian snow cover is extensive, winter temperatures are relatively cold across Northern Eurasia including Northern Europe and the Eastern US with relatively mild temperatures across the Mediterranean, North Africa and Northeast Canada. When snow cover is sparse it favours the opposite temperature anomalies past October Siberian snow cover was only slightly above normal but less than one standard deviation and similar to the last three Octobers despite the change in the phase of ENSO.
To me this is a weak signal, and I don’t think that it provides much predictive value for the winter and is a non-factor in our winter forecast.
Hoeveelheid zee-ijs boven de Noordpool
Recently I have also been researching the relationship between Arctic sea ice extent and winter weather. In general, reduced Arctic sea ice extent is related to cold temperatures across the NH but regionality is important.
Low sea ice in the Barents-Kara Seas favours cold in Asia, low sea ice in the Chukchi and Bering Seas favour cold in eastern North America and low sea ice around Greenland favour’s cold in Northern Europe.
This fall and early winter, the region that has experienced the greatest negative anomalies in sea ice extent in the Arctic has been in the Barents-Kara Seas.

I interpret the sea ice anomalies as favouring cold temperatures for Asia and even possibly for Europe. And so far in December, Europe has experienced some very cold temperatures early on, but it is looking milder through the end of the month. Instead, the cold has moved into Asia, but even there it looks to turn milder by month’s end.
But the region that has the least ice coverage relative to normal is Hudson Bay, which is outside of the Arctic. The low sea ice in Hudson Bay could be contributing to well above normal temperatures in Canada observed this month.
Invloed van zee-ijs en sneeuwdek op Polar Vortex
I and others have argued that Siberian snow cover and Arctic sea ice can influence winter weather across the mid-latitudes through interactions with the polar vortex (PV). The PV is a fast-flowing ribbon or river of air that circumnavigates the Arctic high above the earth’s surface in the stratosphere.
When the PV is strong, cold air remains confined over the Arctic while the mid-latitudes are relatively mild but when the PV is perturbed or weak the Jet Stream becomes wavier or more meandering allowing cold air from the Arctic to be transported to the mid-latitudes including Europe and the Eastern US.
Both extensive October Siberian snow cover and diminished Arctic sea ice extent in the Barents-Kara Seas are related to a weaker or more perturbed winter PV and colder winter temperatures. Though the forcing from snow cover in October was weak, currently snow depths across most if not all of Siberia are above normal (not shown).
Also, in the Arctic itself, negative sea ice anomalies are focused in the Barents-Kara Seas. Therefore, I believe that both Arctic sea ice and snow depth across Siberia have become more favourable for weakening the PV since the end of October.
Impact van QBO op de Polar Vortex
Another factor that could be important this winter is the phase of the quasi biennial oscillation (QBO). The phase of the QBO is determined by the sign of the winds in the equatorial stratosphere.
When the winds are easterly or negative so is the QBO and when the winds are westerly or positive so is the QBO. Often the winds are from different directions at different levels but the winds in the lower stratosphere are considered most important for the behaviour of the PV. The winds in the lower equatorial stratosphere are currently easterly or negative.
There is both observational and modelling support that an easterly QBO favours a weak PV and relatively cold temperatures across the NH mid-latitudes including Europe.
So even though Arctic forcing favouring a disrupted PV are relatively weak, the easterly QBO could be enhancing this forcing and could eb the deciding factor which favours a weak or disrupted PV.
In figuur1, I also include the winter surface temperature anomalies from the AER statistical model. The major predictors used in the model are predicted winter ENSO (Niño 3.4 index), estimated October Barents-Kara sea ice concentration anomaly, October Eurasian snow cover extent anomaly and the October sea level pressure (SLP) anomaly in northwestern Asia.
The AER statistical model predicts relatively warm temperatures across, Southern and Central Europe, Southern Canada and the Northern US with seasonable to cold temperatures across Northern and East Asia, Northern Canada, Northern Alaska. Once again as in previous winter forecasts, the AER model forecast is colder than the dynamical.
Impact van Canadian warming in november?
So far this November and December, there has been a good amount of high latitude blocking (stagnant high pressure) centered across the northern North Atlantic including Greenland. High latitude blocking is critical for cold weather in the mid-latitudes.
This winter the occurrence of high latitude blocking has been focused in a region stretching from Greenland to the Barents-Kara Seas that brought a cold period to Europe in late November and early December, which then expanded across Siberia and now is filtering into East Asia.
But the blocking is predicted to mostly disappear the second half of December with a very mild pattern across the entire Northern Hemisphere as we enter the holiday season.
However, because the high-latitude bocking has been transitory it has resulted in only minor disruptions of the PV in November and December in the form of a stretched PV or a Canadian warming.
During these events the shape of the PV is not circular, which is the typical state, but instead the PV becomes stretched resulting in Arctic outflow from the Arctic to North America or Eurasia.
A stretched PV in November brought cold Central to East Asia and especially North America mostly east of the Rockies. For Europe there doesn’t seem to be much of a relationship between a stretched PV and temperatures.
Then the Canadian warming helped usher cold to Northern Eurasia including Europe. Also, the cold anomalies from both events tend to last for one to two weeks and not longer. Therefore, the cold will mostly abate across the Northern Hemisphere over the next week or so.
Hoop voor de winterliefhebber in 2024?
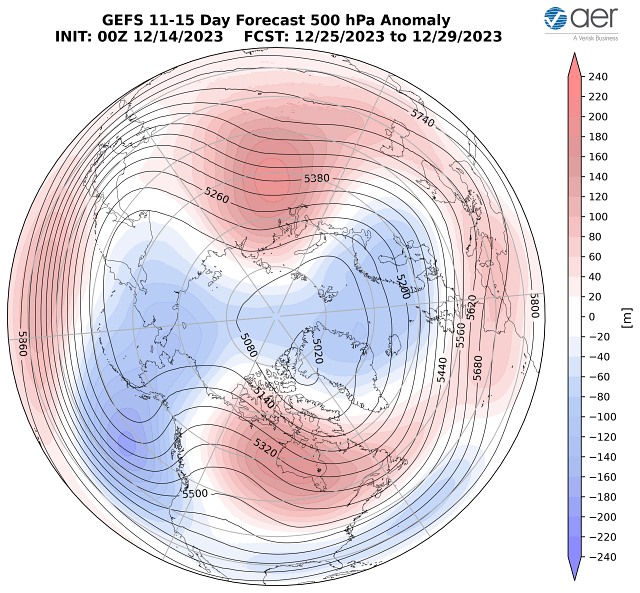
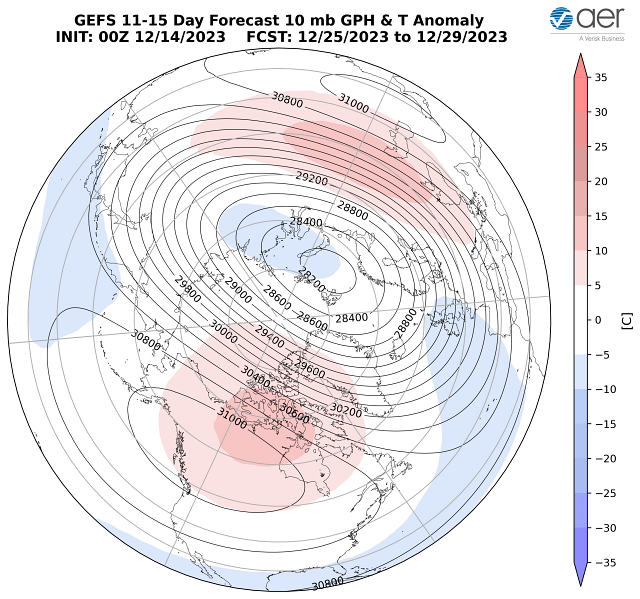
But the models are predicting a return of Ural blocking at the end of the month (zie figuur4). Not only are they predicting Ural blocking but more blocking in Canada with troughing in the North Pacific and the North Atlantic. This is a distinctive wave-two pattern that could force a split of the polar vortex (PV) into two pieces in early January.
There are two types of PV disruptions: displacements and splits. In a PV displacement the PV remains intact but is displaced off the North Pole and weakens.
In a PV split the original one PV splits into two sister vortices that then tend to meander closer to the mid-latitudes. A nice example of a PV split occurred in February 2018. Following the PV split it turned much colder across Europe including Western Europe and at eventually in the Eastern US.
Northern Europe has been cold overall in large part due to the strong Greenland blocking in November and December but the rest of Europe has been milder but colder than recent than recent falls.
However, there exist few signs of a return to Greenland blocking and therefore I expect temperature to remain relatively mild across much of Europe in the next few weeks. As I have discussed previously, the best chance for Northern and Western Europe to have a cold winter is for a PV split to occur. Though a minor SSW will occur over the holiday period (zie figuur5), it will likely require a larger disruption to have a meaningful impact on winter temperatures across the Northern Hemisphere including Europe.
Conclusie
In conclusion, based on above normal October snow cover extent and La Niña our model is predicting the best chances of a cold winter are in Central and East Asia, Northern Canada and the Southcentral US.
The best chance for a cold winter in Europe seems to be limited to across Northern Europe and in particular Scandinavia. For cold temperatures to be more widespread a PV split is necessary in my opinion. There are signs that a PV disruption will occur in late December and into early January based on the dynamical models and based on our own statistical model.
But the PV disruption probably needs to be larger and split into two pieces for at least Europe to have an overall cold winter widespread rather than just limited to Scandinavia.
Deze blog werd aangeleverd door wetenschapper Judah Cohen. Je kan hem ook volgen via X of zijn website aer.com