Outlook winter 2024-2025 door Judah Cohen


0
Another La Niña has emerged this winter the fourth of the past five winters. Despite the change from La Niña to El Niño and back to La Niña, the dynamical model forecasts are not that different from the past four winters, especially over Eurasia. The most commonly used predictor in seasonal prediction is the El Niño/Southern Oscillation or (ENSO).
The government forecast centres rely mostly on dynamical models for seasonal forecasts and they are very sensitive to the phase of ENSO. In Figure 1, I include the multi-model ensemble from the European models (C3S) including the European Centre for Medium-range Weather Forecasting (ECMWF) model, the UK Met Office Hadley Center Unified Model and the and the MeteoFrance model. Almost universal warmth is predicted across Eurasia and North America with the exception of below normal temperatures in the Southern Alaska. Also, the relative warmth across the continents increases at higher latitude especially across Canada and Russia know as Arctic amplification.
Temperatures above normal despite La Niña
Therefore, despite the La Niña, the models have defaulted to a “global warming” forecast with above normal temperatures throughout the continents. In previous years I have also included the North American Multi-model Ensemble (NMME) forecast but it is nearly identical to the C3S so I see little added information by including it.

In contrast, I have focused my research on the contribution of Arctic forcings on mid-latitude weather especially on winter and at seasonal timescales. Much of my research has been on the relationship between October Siberian snow cover extent on winter surface temperature anomalies across the Northern Hemisphere (NH). When October Siberian snow cover is extensive, winter temperatures are relatively cold across Northern Eurasia including Northern Europe and the Eastern US with relatively mild temperatures across the Mediterranean, North Africa and Northeast Canada.
Current status SAI index
When snow cover is sparse it favours the opposite temperature anomalies. This past October Siberian snow cover was above normal and more than the past four Octobers but still less than one standard deviation (see Figure 2). To me this is still a relatively weak signal, and though I think that it provides some predictive value for the winter it is not as strong as in past winters with the strongest being 2014.

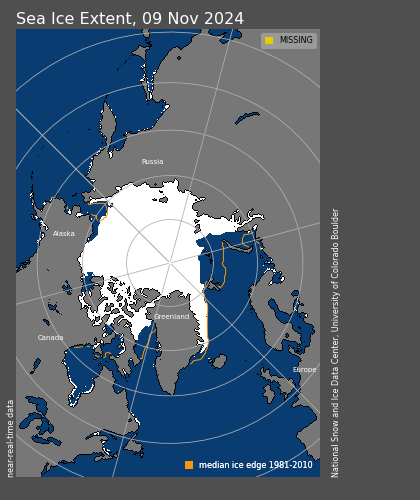
Recently I have also been researching the relationship between Arctic sea ice extent and winter weather. In general, reduced Arctic sea ice extent is related to cold temperatures across the NH but regionality is important. Low sea ice in the Barents-Kara Seas favours cold in Asia, low sea ice in the Chukchi and Bering Seas favour cold in eastern North America and low sea ice around Greenland favour’s cold in Northern Europe. This fall, the region that has experienced the greatest negative anomalies in sea ice extent in the Arctic has been in the Barents-Kara Seas (see Figure 3).
I interpret the sea ice anomalies as favouring cold temperatures for Asia. And so far in December, Central and East Asia have experienced some cold temperatures and even heavy snow in regions. But the region that has the least ice coverage relative to normal is Hudson Bay, which is outside of the Arctic. The low sea ice in Hudson Bay could be contributing to well above normal temperatures in Canada and even the United States (US) predicted for the end of December.
I and others have argued that Siberian snow cover and Arctic sea ice can influence winter weather across the mid-latitudes through interactions with the polar vortex (PV). The PV is a fast-flowing ribbon or river of air that circumnavigates the Arctic high above the earth’s surface in the stratosphere.
Impact of the Polar Vortex
When the PV is strong, cold air remains confined over the Arctic while the mid-latitudes are relatively mild but when the PV is perturbed or weak the Jet Stream becomes wavier or more meandering allowing cold air from the Arctic to be transported to the mid-latitudes including Europe and the Eastern US. Both extensive October Siberian snow cover and diminished Arctic sea ice extent in the Barents-Kara Seas are related to a weaker or more perturbed winter PV and colder winter temperatures.
Though the PV has been relatively strong so far this winter, it has experienced repeated and in quick succession stretching. PV stretching delivers cold temperatures to both Asia and North America but usually not Europe. The repetitive PV stretching has resulted in below normal temperatures from Western Canada to the Eastern US and Central and East Asia. Overall Europe has been relatively mild with the exception of northern Scandinavia, a pattern common to recent winters (see Figure 4).

Another factor that could be important this winter is the phase of the quasi-biennial oscillation (QBO). The phase of the QBO is determined by the sign of the winds in the equatorial stratosphere. When the winds are easterly or negative so is the QBO and when the winds are westerly or positive so is the QBO. Often the winds are from different directions at different levels but the winds in the lower stratosphere are considered most important for the behaviour of the PV.
The winds in the lower equatorial stratosphere are currently westerly or positive. There is both observational and modelling support that a westerly QBO favours a strong PV and relatively mild temperatures across the NH mid-latitudes including Europe. So even though Arctic forcing favour a disrupted PV, the westerly QBO could be opposing this forcing and may be supporting the strong PV of the early winter.
In Figure 5, I show the winter surface temperature anomalies from the AER statistical model. The major predictors used in the model are predicted winter ENSO (Niño 3.4 index), September Arctic sea ice concentration, October Eurasian snow cover extent anomaly and the October sea level pressure (SLP) anomaly in northwestern Asia.
The AER statistical model predicts relatively warm temperatures across Europe, Northern and Eastern Canada and the Southern and Eastern US with seasonable to cold temperatures across Southern Siberia, parts of Central and East Asia, parts of Alaska, Central Canada the Northcentral US. Once again as in previous winter forecasts, the AER model forecast is colder than the dynamical model forecasts.

So far this November and December, there has been a good amount of high latitude blocking (stagnant high pressure) centered across the northern North Atlantic including Greenland. High latitude blocking is critical for cold weather in the mid-latitudes. This winter the occurrence of high latitude blocking has been focused in a region stretching from Greenland across the Northern North Atlantic and even into Europe in December. And the blocking is predicted to expand include Alaska and possibly near the Urals. Urals is important because Ural blocking favors a weakening of the PV.
However, because the high-latitude Ural blocking has been transitory so far this late fall and early winter, it has resulted in only minor disruptions of the PV in November and December in the form of four stretched PVs and one Canadian warming. During stretched PV events the shape of the PV is not circular, which is the typical state, but instead the PV becomes stretched resulting in Arctic outflow from the Arctic to North America or Eurasia. One stretched PV in November and three in December brought cold temperatures to Central and East Asia and especially North America to both Canada and the US mostly east of the Rockies (see Figure 4).
Stretched Polar Vortex
For Europe there doesn’t seem to be much of a relationship between a stretched PV and temperatures. Then the Canadian warming, where the polar stratosphere dramatically warms over Canada, predicted at the end of December will bring record warm temperatures to Eastern Canada and maybe the US to end the year. Also, Canadian warmings often spawn Greenland blocking, which is predicted in early January. This should help return relatively cold temperatures to Europe in early January.
However the Canadian warmin this December is weaker and of much longer duration than last year. Last year’s Canadian warming in December resulted in warming across North America for the entire month. But also because it was bigger the PV than transitioned to a larger sudden stratospheric warming (SSW) in mid-January.
Though Ural blocking reamins transient it will be of suffiicient amplitude at the end of December to initiate a fifth stretched PV. This will bring cold air to Asia but especially Canada and the US east of the Rockies for the first half of January. Though this will likely be the largest stretched PV of the season so far, once again I do anticipate that its duration and impact will be of short duration on the order of a week or so.
An overall lack of cold in Europe during December has been duer to transient Greenland blocking in December. However, due to the Canadian warming in the polar stratosphere the weather models are predicting a return of Greenland blocking in early January and this should bring with it colder temperatures to Europe (see Figure 6). But without a preceding SSW, the Greenland blocking looks to be transient and will likely require a larger disruption to have a meaningful impact on winter temperatures across the Northern Hemisphere including Europe. Though the models are predicting that Alaska high pressure/blocking will drift towards the North Pole (see Figure 6) that could prolong the cold in Europe.

At AER we do run a statistical polar vortex strength model. It does have many flaws and it is overly simplistic but it is sugegsting an SSW at the end of January. As far as I can tell the weather models are not predicting an SSW for the foreseeable future. But if we do get an SSW at the end of January, especially a PV split, then Febraury could be a cold month across parts of the Northern Hemsiphere including Europe.
Conclusion
Based on above normal October snow cover extent, below normal Arctic sea ice during the fall and La Niña our model is predicting the best chances of a cold winter are in Central and East Asia, Central Canada and the Northcentral US. The best chance for a cold winter in Europe seems to be across Northern Europe and in particular Scandinavia. For cold temperatures to be more widespread a PV split is probably necessary in the next several weeks in my opinion.
There are signs that a PV disruption will occur in late January, almost exclusively based on our statistical PV strength model but not based on the dynamical weather models. But the PV disruption probably needs to be larger than the stretched PV (see Figure 7) that we have been repeatedly observing so far this winter and probably needs to split into two pieces for at least Europe to have an overall cold winter widespread rather than just limited to Scandinavia. Large warming is predicated over Asia in early January (see Figure 7) that could be a sign of a looming larger PV disruption later in the month.
